Last updated: July 26, 2026
PHOTON is a research architecture for large language models from Fujitsu, with RIKEN AIP, Institute of Science Tokyo and Tokai University, announced 24 June 2026 and published at ACL 2026. Its headline figure, 475×, is a ratio inside a normalised metric the paper calls throughput per unit memory. It is not a reported wall-clock speedup. It is also unrelated to Databricks Photon or VMware Photon OS, which share the name.
Verdict in one line: the 475× figure is the paper’s maximum throughput-per-KV-cache-memory ratio, not a disclosed wall-clock speedup or a per-GPU capacity result.
Fujitsu published a research page headlined “Up to 475× Higher Output Tokens per GPU than Transformer,” defining the measure as throughput per unit of GPU resource. The paper defines the same quantity as throughput divided by the key-value cache footprint of a single sample. Those are different denominators, and neither document publishes the conversion between them. In the English results we sampled on 27 July 2026, coverage restated the multiplier without separating the two.
- Plan inference capacity or GPU procurement
- Have been asked whether this announcement changes anything
- Need to take a vendor efficiency multiple apart
- Want something callable or licensable today
- Are comparing prices. There is no price
- Arrived searching for Databricks Photon or Photon OS
| Settles | Which table cell produced 475, what units it carries, what it cost in benchmark quality, and which paper version contains which evidence. |
| Does not settle | How the metric converts to one physical GPU, what batch and concurrency produced it, how PHOTON compares against a grouped-query or latent-attention baseline, or what it consumes in power. |
| Does not assert | That any figure is wrong, that any baseline was chosen in bad faith, or that the announcement is deceptive. Where sources differ, both are quoted. |
| Announced | 24 June 2026, Fujitsu research topic page, English and Japanese |
| Published | ACL 2026, Volume 1 Long Papers, pages 38365 to 38383 |
| Source of 475× | One cell: 1.2B parameters, decode-heavy profile, Table 2 |
| Metric | TPM, throughput divided by per-sample KV cache, in K tokens/s/GiB |
| Range across main cells | 286× to 475×, across three model sizes and two profiles |
| Main models | 600M, 900M, 1.2B. One further experiment at 2.4B under a modified setup |
| Hardware | NVIDIA DGX H200. GPU count per measurement not stated |
| Serving conditions | Batch, concurrency, precision and aggregation method not stated |
| Release status | No code, weights, API, licence or price located in official sources checked 27 July 2026 |
What 475× measures
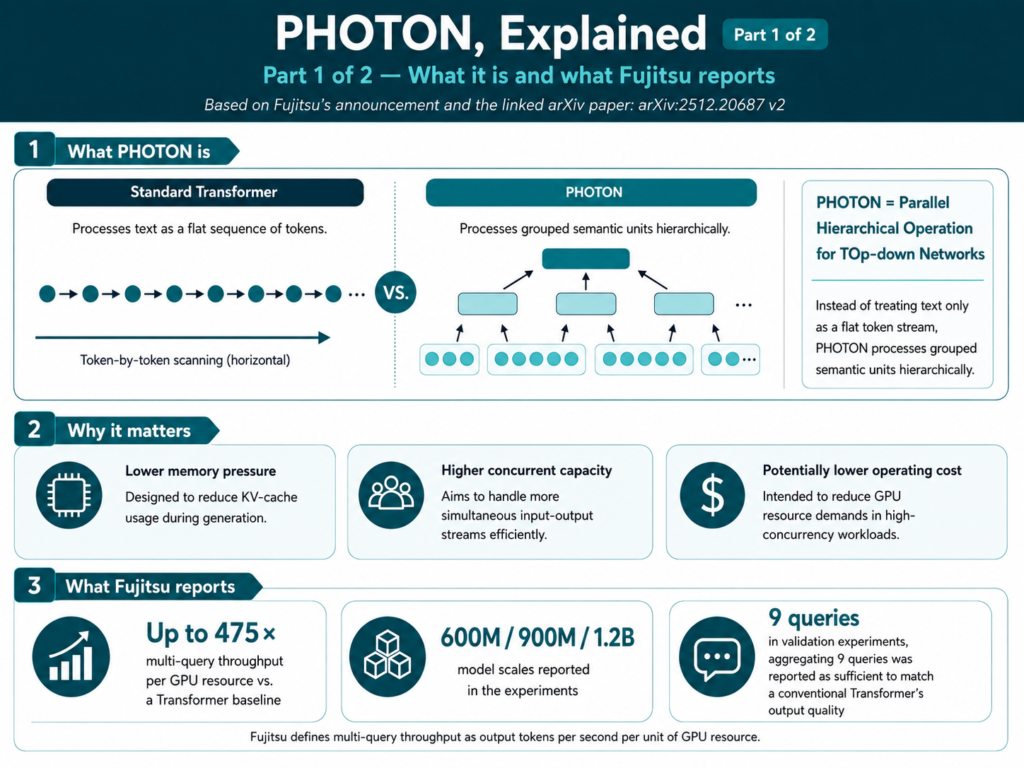
The figure does not come from a comparison of how quickly two GPUs finish the same request. It comes from a normalised metric the paper calls TPM, throughput per unit memory, obtained by dividing throughput by the key-value cache footprint of a single sample in gibibytes. The memory in that denominator excludes model weights, activations and allocator overhead. It is cache only.
The headline value appears in one cell of the main comparison: 1.2B parameters, decode-heavy profile, meaning a 128-token input and a 2048-token generation.
| Reported measure | Vanilla Transformer | PHOTON | Ratio |
|---|---|---|---|
| Throughput | 1.00 K tok/s | 43.80 K tok/s | 43.8× |
| Per-sample KV cache | 0.390 GiB | 0.036 GiB | 10.83× smaller |
| TPM | 2.56 K tok/s/GiB | 1216.67 K tok/s/GiB | 475.26× |
Values as printed in Table 2. Ratios calculated by Future Stack Reviews. The arithmetic is internally consistent: 1216.67 divided by 2.56 gives 475.26, and multiplying the two displayed component ratios gives approximately 474.5, with the difference explained by rounding.
Across all six main cells, three model sizes against two profiles, the ratio ranges from roughly 286× to 475×. The announcement uses the highest point in that grid. A maximum is a legitimate result to report, but it is not the architecture’s uniform advantage.
The gap opens at translation. Fujitsu’s headline reads “Up to 475× Higher Output Tokens per GPU than Transformer,” and its note defines multi-query throughput as “throughput (output tokens per second) per unit of GPU resource.” Neither document states what one unit of GPU resource is, or how per-sample cache gibibytes convert into tokens produced by one physical GPU.
The Japanese version of the same page carries a third figure that its visible text does not. Its description metadata, the string search engines and share cards render, opens with 1,000倍, a thousand times the multi-query performance of Transformer, before giving 475 in the following sentence. The English page’s metadata carries no multiple at all. The paper’s abstract also states a thousand-fold figure, up to 10³ times higher throughput per unit memory, which rests on a decoding mode called recursive generation whose output quality the paper states it does not evaluate.
curl -s "https://global.fujitsu/ja-jp/technology/research/article/topics/202606-photon-architecture" \ | grep -o '<meta[^>]*description[^>]*>'
Note the comma. Searching the page for 1000 will not match, and searching the rendered page will not match either, because the string sits in the document head rather than the body. Checked from inside and outside Japan on 27 July 2026 with identical results.
Sources: Fujitsu, 24 June 2026, headline and Note 1 · Fujitsu, 24 June 2026, Japanese, page metadata · ACL 2026 Proceedings, July 2026, Abstract, Section 3 and Table 2
What is not disclosed
The central serving table does not state the inference batch size, the number of concurrent sequences, the inference precision, the runtime or kernel configuration, or how many GPUs each measurement used. The batch size of 256 given in the implementation appendix is a training batch.
The table caption specifies per sample only for memory. For throughput it gives units alone. The evaluation text says the authors follow the empirical protocol of the Block Transformer paper, which PHOTON compares itself against, but does not restate what that protocol does for throughput normalisation.
This matters because throughput, cache efficiency and concurrency are related without being interchangeable. A smaller per-sample cache can let a fixed-memory GPU hold more active sequences, and that can raise aggregate output when enough requests arrive. Whether it does, and by how much, depends on the scheduler, batch composition, kernel efficiency, latency target, weight residency, activation memory and allocator behaviour. Table 2 reports per-sample cache, not peak total device memory. The distance between those two quantities is where a capacity forecast would have to be built, and the paper does not publish it.
| Reported | Table 2 gives a 43.8× throughput ratio and a 10.83× smaller per-sample KV cache in the headline cell. |
| Calculated | Those two displayed ratios reconstruct the 475× TPM figure. The full grid ranges 286× to 475×. |
| Unresolved | Whether the reported throughput already reflects cache-enabled concurrency, and how TPM maps to one physical GPU. Neither can be established from the disclosed harness. |
Sources: ACL 2026 Proceedings, July 2026, Section 3 Evaluation, Table 2 caption and Appendix D.1
What the latency table proves
The ACL version adds a table the arXiv version does not have, reporting single-batch latency. At 1.2B in the decode-heavy setting it gives 42,264.81 milliseconds for the vanilla Transformer against 9,278.10 for PHOTON, a ratio of 4.56×. In prefill-heavy the ratio is 4.52×.
This is a material result and it is separate from the TPM normalisation. Whatever the metric boundary, PHOTON records substantially lower latency than both baselines at every size tested, with no benefit from batching. Anyone dismissing the architecture as a normalisation artefact has to account for it.
The table does not close the serving-method gap, and its own definition is unclear. The surrounding text describes the metric as the delay before the first token is produced. The figures do not behave that way. Decode-heavy latency is 15.4 times prefill-heavy latency for the vanilla model, closely tracking the 16-fold difference in output length between the two profiles, while the prefill-heavy profile has the longer prompt and should therefore show the longer first-token delay. The published record does not resolve whether the table reports time to first token or total generation time, and it does not confirm that this table and the throughput table used the same precision, kernels and GPU allocation.
Until that is clarified, the latency figures support one conclusion and not a second. They establish a reported 4.5× latency advantage at 1.2B. They cannot be converted into a per-stream token rate, and so they cannot be used to determine what the throughput column already contains.
Sources: ACL 2026 Proceedings, July 2026, Appendix C.5 and Table 8 · arXiv, 8 January 2026, version 2, which contains no equivalent table
What it cost at 1.2B
At 1.2B parameters every quality metric in the main table favours the vanilla Transformer.
| Metric | Vanilla | PHOTON | Change |
|---|---|---|---|
| WikiText perplexity | 19.6831 | 23.7863 | 20.85% higher |
| HellaSwag | 45.65 | 40.70 | 4.95 points lower |
| SciQ | 81.50 | 69.30 | 12.20 points lower |
| ARC-Easy | 49.33 | 46.25 | 3.08 points lower |
| Three-task mean | 58.83 | 52.08 | 6.74 points lower |
Values as printed in Table 2. Percentage and point changes calculated by Future Stack Reviews.
Fujitsu summarises this as “a modest reduction in generation quality.” That is the vendor’s characterisation and no metric is named against which modest is judged. A 3-point movement on ARC-Easy and a 12-point movement on SciQ both sit inside the phrase.
Block Transformer, the 2024 architecture PHOTON extends and measures against, scores better than PHOTON at 1.2B on perplexity, HellaSwag and SciQ. PHOTON leads it on ARC-Easy by 0.42 points and on TPM by roughly 2.25 times. The claim PHOTON makes against that baseline is about the efficiency and quality frontier taken together.
Sources: ACL 2026 Proceedings, July 2026, Table 2 · Fujitsu, 24 June 2026
Evidence that exists only in the ACL version
Three versions of this paper exist: a preprint from 22 December 2025, a revision from 8 January 2026, and the ACL camera-ready from July 2026. The announcement of 24 June carries one research link, to the arXiv abstract, which serves the January revision.
That matters for one sentence in the announcement: “In validation experiments, aggregating as few as 9 queries was sufficient to match the output quality of a conventional Transformer.” The same paragraph says results are aggregated by majority voting or best-of-N selection.
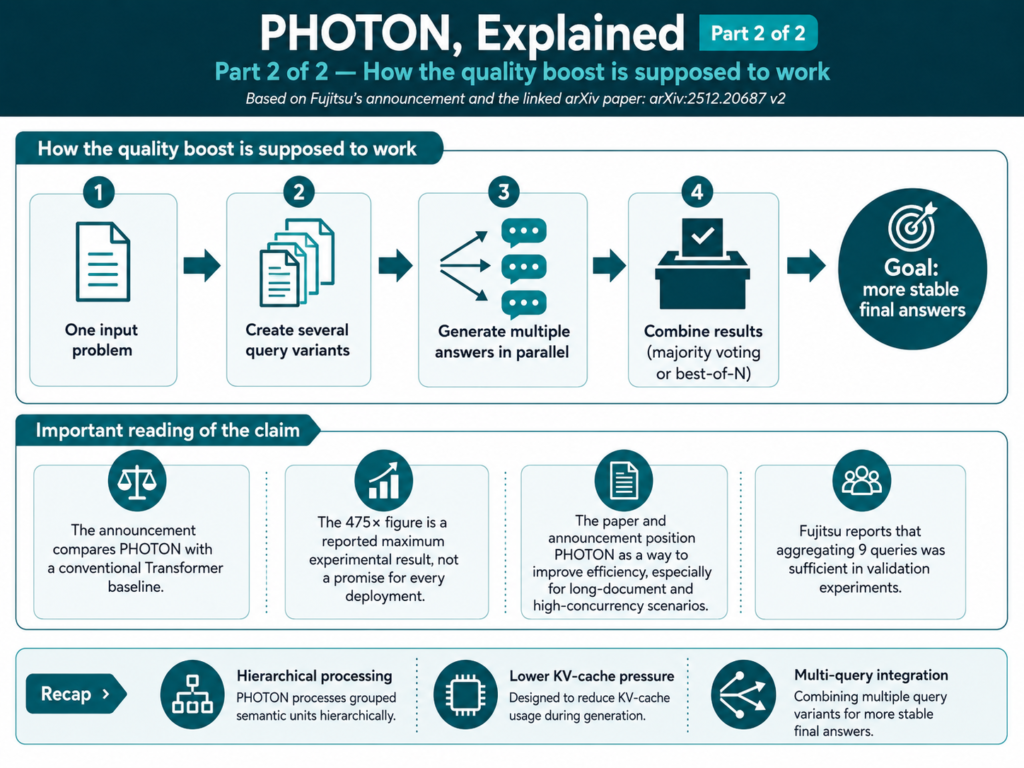
No such experiment appears in the January revision. It appears in the camera-ready, in Section 3.3 and Table 5. A reader following the announcement’s own link does not reach the evidence for the announcement’s own claim.
The experiment, once located, supports the sentence in part. Nine lightly perturbed copies of a question are decoded in parallel and the answer with the highest likelihood is selected, which is best-of-N. We found no majority-voting experiment in the reported evaluation.
| Method, N=9 | ARC-Easy | SciQ |
|---|---|---|
| Vanilla Transformer, 1.2B, single query | 49.33 | 81.50 |
| PHOTON single query | 46.21 | 69.10 |
| PHOTON, paraphrase | 57.41 | 76.60 |
| PHOTON, token-insert | 52.44 | 77.90 |
| PHOTON, span-insert | 51.26 | 79.00 |
Values from Table 5, with the vanilla row from Table 2 for comparison. Table 5 does not state its model size; its single-query baseline matches the 1.2B row of Table 2 to within 0.2 points.
All three strategies exceed the vanilla Transformer on ARC-Easy. None reach it on SciQ, the closest falling 2.50 points short and the strongest ARC-Easy strategy falling 4.90 points short. HellaSwag and perplexity, two of the four quality metrics used in the main table, are not evaluated under the nine-query protocol. The paraphrase strategy uses GPT-4 to generate the query variants, a dependency the paper notes when observing that the other two strategies use no external model.
Sources: ACL 2026 Proceedings, July 2026, Section 3.3 and Table 5 · arXiv, version history, v1 22 December 2025 and v2 8 January 2026 · Fujitsu, 24 June 2026, Related Links
Which baselines were tested
The paper compares PHOTON against a vanilla Transformer and against Block Transformer. In the 600M to 1.2B configurations it publishes, both PHOTON and the vanilla baseline use 32 attention heads and 32 key-value heads, which is full multi-head attention. The configurations for the 2.4B experiment are not published.
The paper does not compare against grouped-query attention, multi-head latent attention, quantised key-value caches, sliding-window or sparse attention, paged allocation, continuous batching, prefix caching or speculative decoding. Several of these reduce cache footprint directly, which is the quantity PHOTON’s advantage is measured in.
This is a limit on how far the result transfers to deployment, not evidence of a stacked comparison. Applying cache reduction to the baseline while leaving PHOTON’s own 32 key-value heads untouched would be the asymmetric test. What the record supports is narrower and still consequential: Table 2 establishes an advantage over the architectures the paper tested, and does not establish one over a modern optimised serving stack.
Two further results are worth holding against an easy dismissal. Changing the chunk lengths from four and four to two and two lowers perplexity from 29.91 to 24.28 and raises mean zero-shot accuracy from 48.72 to 52.01 while still delivering roughly 54 to 57 times the vanilla TPM. That trade-off is published by the authors, not uncovered against them. And the throughput anomaly at 900M, where every architecture peaks and then falls at 1.2B, appears in all three architectures in both profiles, which gives no basis for reading the baseline as selectively weakened.
The modified 2.4B experiment
The camera-ready adds one experiment above the main table, at 2.4B parameters, where the decode-heavy TPM ratio is 214× and the prefill-heavy ratio is 184×.
| Model size | Decode-heavy TPM ratio |
|---|---|
| 600M | 417× |
| 900M | 423× |
| 1.2B | 475× |
| 2.4B, modified setup | 214× |
Ratios calculated by Future Stack Reviews from Table 2 and Table 9. The 2.4B row is not a continuation of the same series.
The quality gap also widens. Perplexity moves from 14.72 to 21.06 and the mean of the three zero-shot benchmarks falls 8.32 points, against 6.74 at 1.2B.
The comparison requires care, and the paper supplies the reason. At 2.4B the PHOTON model is built on a Qwen3 backbone while the baseline is LLaMA-based, the corpus is RefinedWeb rather than the Pile, and the training context is 4096 rather than 2048. Attention configurations for that pair are not disclosed. The paper describes the outcome as the same trend as the smaller models, which is directionally accurate. What the figures show alongside it is that the largest multiple in the record belongs to the second-smallest model tested and does not persist in the modified experiment at the next scale.
Sources: ACL 2026 Proceedings, July 2026, Appendix C.6 and Table 9
Availability and buyer decision
There is no price comparison to make. In the official sources we checked on 27 July 2026, being Fujitsu’s pages in both languages, both arXiv versions, the ACL camera-ready and its checklist, no repository, model weights, API endpoint, usage licence, price, availability date or product integration was located. That is a dated search result rather than proof that nothing exists.
The practical position for a technical buyer follows from the evidence rather than from the multiplier. The research significance is real: the reported cache and latency advantages are large and were peer reviewed. The procurement significance is undetermined, because the serving conditions needed to convert a normalised metric into fleet capacity are not published. The correct action today is to monitor, not to revise a 2026 to 2027 capacity assumption.
| 1 | Batch size, concurrent sequences, inference precision and GPU count for the throughput table. |
| 2 | How the throughput figure was aggregated or normalised, and whether the latency table shares its harness. |
| 3 | Peak total device memory rather than per-sample cache alone. |
| 4 | A same-backbone comparison at 7B or above against a grouped-query or latent-attention baseline. |
| 5 | Released code or weights, which would let a buyer measure rather than read. |
| 6 | Any power measurement. The announcement connects the work to reduced energy consumption while neither paper version reports a watt. |
Sources: Fujitsu, 24 June 2026, Looking Ahead and Related Links · ACL 2026 Proceedings, July 2026, Section 3 and Appendix D · ACL Responsible NLP Checklist, July 2026
Questions answered
Is PHOTON 475 times faster than a Transformer?
No wall-clock result of that size is reported. The 475 figure is throughput divided by the key-value cache of a single sample, in one 1.2B decode-heavy cell. The paper separately reports a 43.8 times throughput ratio and a 10.83 times smaller cache in that same cell, and a 4.56 times lower single-batch latency.
What does TPM mean in this paper?
Throughput per unit memory, in thousands of tokens per second per gibibyte, where the memory is the per-sample key-value cache footprint. It excludes model weights, activations and allocator overhead. The paper does not publish how that ratio converts into the output capacity of one physical GPU.
Is PHOTON a non-Transformer architecture?
No. Its context encoders are autoregressive Transformers and its local decoders are causal Transformers. The 600M to 1.2B models compared in the main table are built on the LLaMA architecture; the 2.4B PHOTON model is described as Qwen3-based. What PHOTON replaces is the flat token-by-token topology, not attention.
Where is the nine-query evidence?
In the ACL 2026 camera-ready, Section 3.3 and Table 5. It is not in the arXiv version that Fujitsu’s announcement links. In that table the nine-query protocol exceeds the vanilla Transformer on ARC-Easy and falls short on SciQ, and two of the four quality metrics used elsewhere are not evaluated under it.
Can PHOTON be downloaded or purchased?
Not from the sources we checked on 27 July 2026. No repository, weights, API, licence, price or availability date was located across Fujitsu’s pages in both languages, both arXiv versions, the ACL camera-ready and its checklist. This is a dated search result, not proof of non-existence.
Methodology and evidence status
This is a Tier C briefing. Future Stack Reviews did not run, install or benchmark anything, because no runnable release was located. Tier C at FSR means the work is document-first, and that is the condition under which the piece was written rather than a caveat added at the end.
We opened and read in full: Fujitsu’s research topic page in English and Japanese, the arXiv abstract and version history, the arXiv preprint, the ACL 2026 camera-ready and the Responsible NLP Checklist filed with it. Every quoted figure comes from one of those.
| Reported | Printed in a table or stated in the text of a source we opened. |
| Calculated | Arithmetic on reported values, marked in the caption beneath each table. |
| Unresolved | Stated as an open question rather than answered. No inference is presented as a finding. |
| Not found | Searched for and not located, with the date and search scope given. |
An earlier draft of this briefing attempted to reconstruct the undisclosed batch size by dividing the requested output length by the reported single-batch latency. That reconstruction is not published here, because the text surrounding the latency table describes the metric as first-token delay rather than total generation time, and the assumption cannot be sustained against the source. The unresolved status of the throughput figure is reported in its place.
The authors are candid where it costs them. The Limitations section states that a single pretraining corpus was used, that the trade-off is not characterised beyond their largest model, and that no comprehensive sensitivity analysis of chunk sizes was performed. The Responsible NLP Checklist answers no to the question on descriptive statistics and explains that the team reports point estimates without multi-seed statistics, confidence intervals or error bars.
Sources opened: Fujitsu, 24 June 2026, English · Fujitsu, 24 June 2026, Japanese · ACL 2026 Proceedings, July 2026 · ACL Responsible NLP Checklist, July 2026, item C3 · arXiv, 8 January 2026
Verdict
PHOTON is credible architecture research with a large reported efficiency ratio and a peer-reviewed publication behind it. Compressing tokens into semantic chunks and decoding them through bounded local windows produces a much smaller key-value cache, and the paper reports both a smaller cache and lower latency as a result.
Its commercial significance remains unquantified. The 475 figure is valid inside the paper’s own metric and reconstructs exactly from the values printed beside it. It is not a wall-clock speedup, and the paper does not publish the batch, concurrency, precision or total-memory measurements that would be needed to turn it into a statement about one GPU. Fujitsu’s announcement makes that conversion in language without making it in evidence.
For a buyer the position is straightforward. Track the work, ask for the six disclosures listed above, and do not carry the multiplier into a capacity plan until someone can measure it rather than read it.
Tier B means we tested it hands-on. Tier C means the work is document-first, with no hands-on testing.
- Claude Opus 5 vs Opus 4.8: Six Runs, No Detected Difference, and a Migration That Still Needs Work What a measured comparison looks like when the sample size is stated and the result is that nothing moved.
- Ahrefs Agent A Review: $99. The Real Bill Was $827. The Agent Didn’t Know. The headline figure and the figure that arrives on the invoice, measured against each other.
- Claude Sonnet 5 Explained: Cheaper Per Token, Not Per Task The same denominator question in a commercial setting: what a per-unit price does not tell you about per-job cost.
- X Square Robot’s WALL Models: What Is Released, What Is Only Published, and What Is Neither The distinction PHOTON sits inside. Published is not released, and released is not obtainable.
- RL Environment Platforms Are Not Yet a Single Buyable Product When a category has results worth tracking but nothing a buyer can put on a purchase order yet.
If you have measured PHOTON, hold a serving-harness disclosure for the throughput table, or can correct anything above, we want to hear from you. Corrections are published with the same prominence as the original claim.
Future Stack Reviews publishes structural audits of AI and SaaS products for technical buyers. This briefing is Tier C, meaning it is built from documents rather than hands-on testing, and that boundary is stated in the Methodology section rather than implied. Reported figures are quoted from primary sources dated 24 June 2026 and July 2026. Calculated figures are marked in the caption beneath each table. Availability and release status were rechecked on 27 July 2026 and will be rechecked when code, weights or a serving-harness disclosure is published. Paper version used: ACL 2026 camera-ready, with arXiv v2 cited where the two differ.
Last updated: 27 July 2026.